Insights
You can get an overview of your Web Story performance easily within Slidy and track the most important Web Story metrics. Read on for more information!
To access the Insights environment in Slidy click onto Insights on the left side of the Slidy home screen. You will see an analytics dashboard like this:
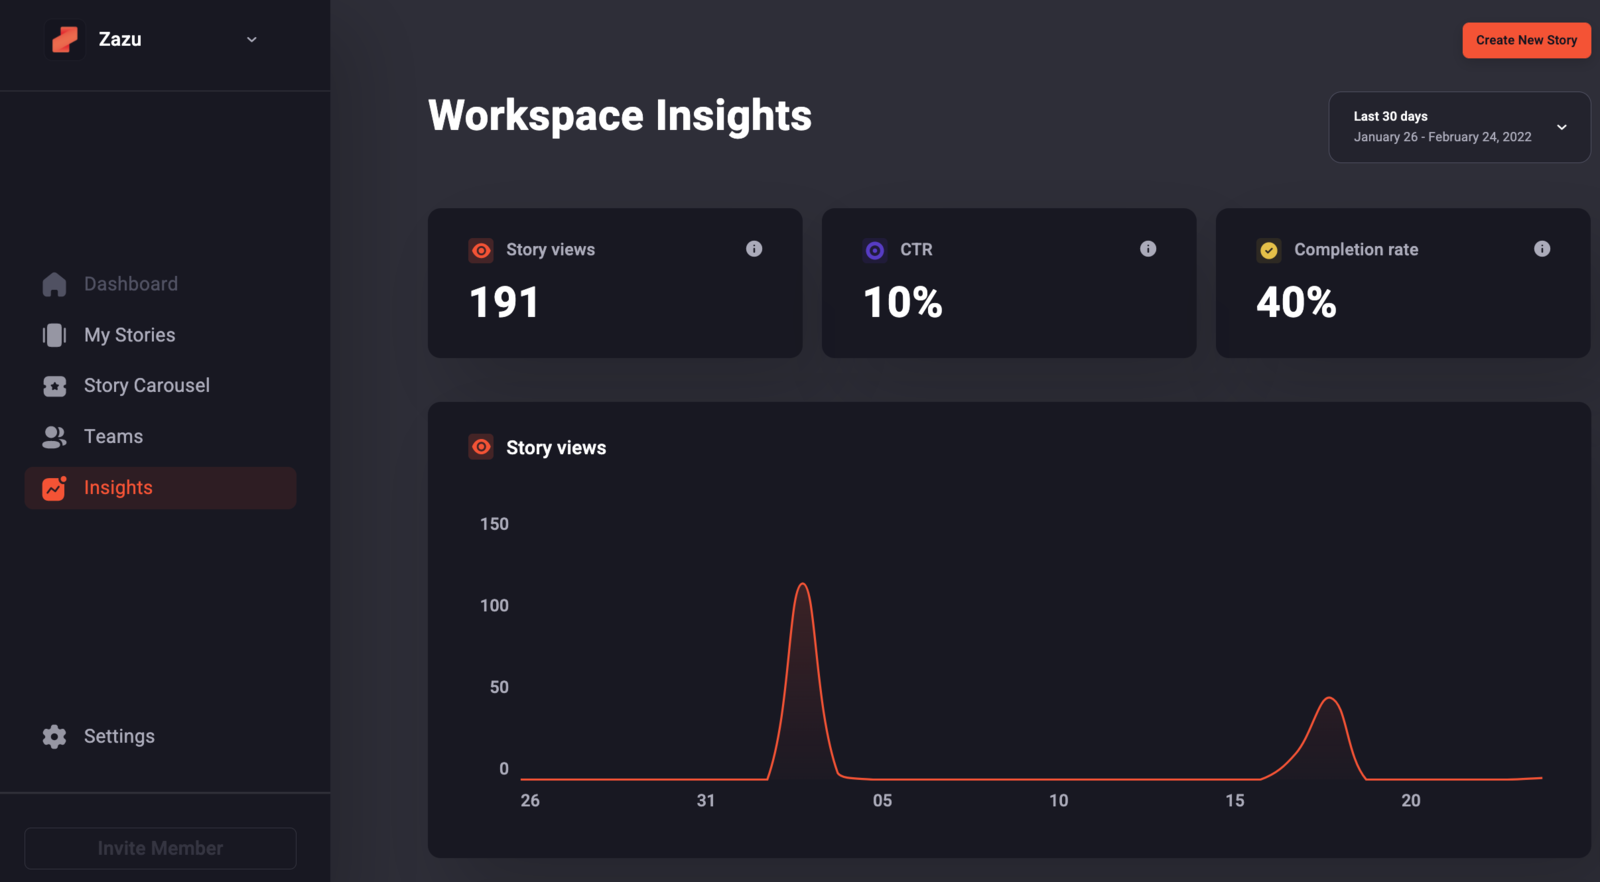
This dashboard shows you the following information for all Stories published within that Workspace:
- Story views: shows you the number of times people have watched your Web Stories
- CTR: shows you how often people who watched your Stories clicked on a Call-To-Action (CTA)
- Completion Rate: shows you how often people reached the last slide of your Web Stories
- Line graph: shows you the development of all Web Story views over a period of time. Hover over a date to see more information.
💡 Tip: You can adjust the time period for your analytics results in the top right corner
Below the dashboard you will see a table with the metrics for each story separately. Each of the metrics can be sorted to better compare stories. Simply click onto the metric name to sort. This is how you can track the performance of you Web Stories within Slidy.